Technology
The stack behind every lit street.
Field-hardened hardware, redundant communications, encrypted cloud, and an AI assistant that knows your network — built end-to-end in South Africa.
Field to control room, in four layers.
Field Nodes
Per-fitting smart nodes with sensors, comms and edge logic.
GSM / LoRa Gateway
Aggregates node telemetry over hybrid wireless.
LumaTrack Cloud
POPIA-compliant cloud with 99.5% SLA and regional redundancy.
Web + Mobile + Dispatch
Operator portals, contractor mobile, and armed response feed.
From edge to client — intelligent data flow
LumaTrack collects data from smart lighting assets at the edge, processes and classifies events on the platform, and routes real-time insights through role-based portals to the right teams and clients for action.
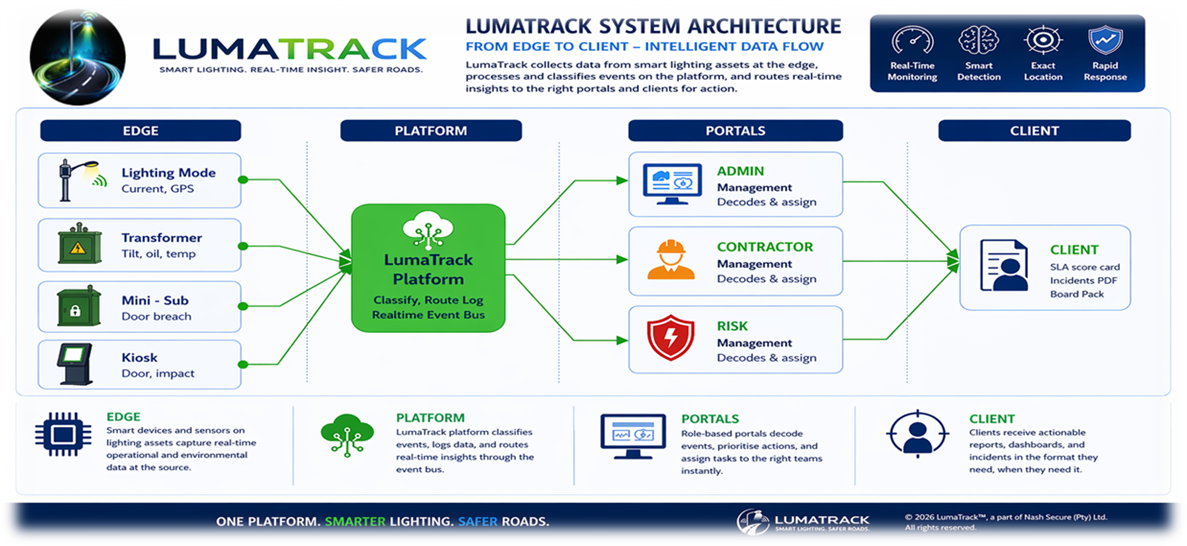
Edge
Smart devices and sensors on lighting assets capture real-time operational and environmental data at the source.
Platform
The LumaTrack platform classifies events, logs data and routes real-time insights through the event bus.
Portals
Role-based portals decode events, prioritise actions and assign tasks to the right teams instantly.
Client
Clients receive actionable reports, dashboards and incidents in the format they need, when they need it.
Built for the South African pole.
- IP66-rated enclosure, –20°C to +70°C operating range
- Dual-SIM LTE-M / NB-IoT + LoRaWAN fallback
- On-board tilt, vibration, current and door-open sensors
- Super-capacitor backup for outage reporting (no batteries to fail)
- Surge protection to ICNIRP / IEC 61643 standards
- OTA-upgradable firmware
Encrypted, audited, in-country.
- POPIA-compliant data residency in South Africa
- TLS 1.3 in transit, AES-256 at rest
- Role-based access control with full audit logging
- 99.5% platform SLA with regional failover
- Open API for SCADA, GIS and asset-management integration
- ISO 27001-aligned operational controls
Edge sensing, cloud-validated.
Every LumaTrack node carries a stack of low-power sensors that continuously sample the local environment and the electrical state of the asset it's bolted to. Detections are made at the edge (on the node) for instant response and validated at the cloud against historical baselines to suppress false positives.
| Detection | Sensor / Method | Action |
|---|---|---|
| Lamp failure | Current draw vs. expected schedule | Auto-create fault, assign nearest contractor |
| Cable theft | Sudden current drop > threshold across two upstream nodes | Critical alert, GPS-pinpoint break, notify Risk + SAPS |
| Cable fault (insulation, joints) | Resistance / impedance mismatch between paired nodes | Standard alert with calculated GPS of fault midpoint |
| Kiosk / mini-sub door open | Reed switch + accelerometer | Tamper alert with photo (where camera fitted) + dispatch |
| Enclosure shake / impact | 3-axis accelerometer thresholding | Vandalism alert, real-time |
| Power loss to feeder | Loss of mains + battery hold-up | Mass-event alert, indicates upstream transformer/feeder issue |
| Comms loss | Heartbeat absence > 10 min | Offline alert, distinguishes from power loss |
| Energy anomaly | kWh trending vs. baseline | Highlights bypass / unauthorised tap |
| Unauthorised site visit | GPS of staff vs. logged work order | Risk Portal investigates |
Edge-to-cloud detection in three steps
Sample
Each node samples voltage, current, vibration, door state and GPS.
Decide
Local thresholds raise an alert in < 2 s — no need to wait for a server round-trip.
Validate
The cloud cross-checks the alert against neighbouring nodes and historical baselines, then promotes it to Info / Warning / Critical and routes it to the right portal.
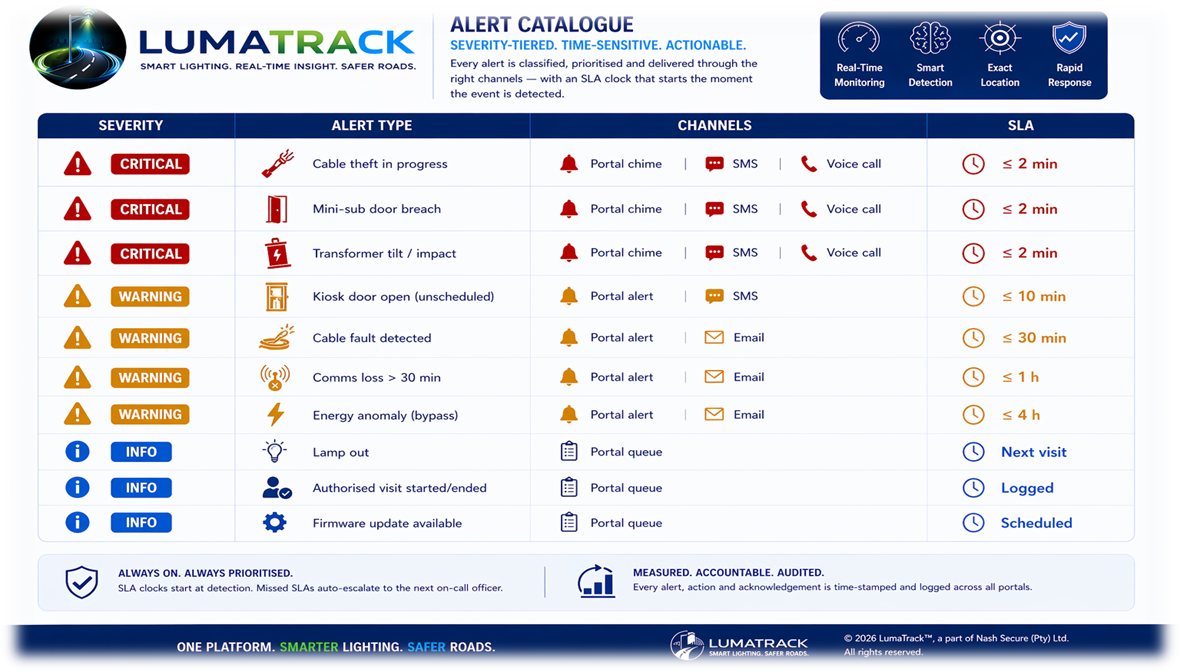
Severity-tiered. Time-sensitive. Actionable.
Every alert is classified, prioritised and delivered through the right channels — with an SLA clock that starts the moment the event is detected. Critical events fire portal chimes, SMS and voice calls in under two minutes; warnings flow to portal alerts and email; informational events queue silently for the next visit.
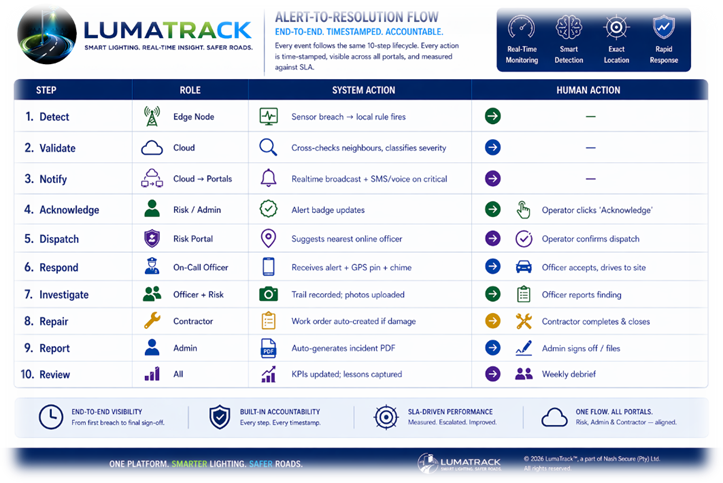
End-to-end. Timestamped. Accountable.
Every event follows the same 10-step lifecycle — Detect, Validate, Notify, Acknowledge, Dispatch, Respond, Investigate, Repair, Report, Review. Each step records both the system action and the human action, is time-stamped, visible across all portals and measured against SLA. One flow. Risk, Admin and Contractor — aligned.
Meet Ask Nash.
The AI assistant built into the LumaTrack platform. Ask it anything about your network in plain English — "Which masts on N3 had outages this week?" — and get answers, charts and exports in seconds.
Want a deeper technical briefing?
We'll walk your engineering team through the architecture and integration paths.
Request Technical Briefing